Introduction
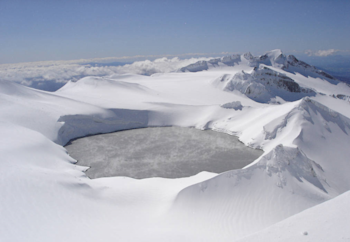
Mount Ruepehu is an active volcano on the North Island which is skied in winter and walked in summer.
This analysis looks at whether anyone should swim in the crater lake at the top of the mountain.
Data
We can access volcano field time series temperature observation results data from GeoNet.
According to the GeoNet FITS API documentation, the following API endpoints are available:
-map: Simple maps of sites.
-method: Look up method information.
-observation: Look up observations.
-observation/stats: Get observation statistics.
-plot: Simple plots of observations.
-site: Look up site information.
-spark: Simple spark lines of recent observations.
-type: Look up observation type information.
In order to get the data from a URL endpoint we can use the httr package GET function using the query parameters in the function or we can add these URL parameters to the URL and create an API request string.
Let’s take a look at the temperatures for one sample site id from the observation endpoint.
# Create the base url
base_url <- "http://fits.geonet.org.nz/observation"
# Get the temperature data for Ruepehu site ids https://fits.geonet.org.nz/
ruepehu_ids <- c("RU001A","RU001B","RU001","RU002","RU003","RU004","RU010","RU020")
query <- "?typeID=t&siteID="
url_response <- httr::GET(paste0(base_url,query,ruepehu_ids[7]))
# Check the status of the GET request
httr::http_status(url_response)## $category
## [1] "Success"
##
## $reason
## [1] "OK"
##
## $message
## [1] "Success: (200) OK"For site id RU010, let’s take a look at the response.
# Take a look at the summary of the reponse
url_response## Response [http://fits.geonet.org.nz/observation?typeID=t&siteID=RU010]
## Date: 2019-09-28 03:31
## Status: 200
## Content-Type: text/csv;version=1
## Size: 8.81 MB
## date-time, t (C), error (C)
## 2007-05-21T00:45:00.000Z,9.790000,0.000000
## 2007-05-21T01:00:00.000Z,9.810000,0.000000
## 2007-05-21T01:15:00.000Z,9.910000,0.000000
## 2007-05-21T01:30:00.000Z,9.980000,0.000000
## 2007-05-21T01:45:00.000Z,10.040000,0.000000
## 2007-05-21T02:00:00.000Z,10.090000,0.000000
## 2007-05-21T02:15:00.000Z,10.110000,0.000000
## 2007-05-21T02:30:00.000Z,9.970000,0.000000
## 2007-05-21T02:45:00.000Z,10.030000,0.000000
## ...The GET request response includes the following information:
- Date : time and date for the GET request
- Status : Numerical code: 200 is a ‘successful request’, 404 is ‘file not found’, 403 is ‘permission denied’
- Content-Type : tells us the data file type from the API. In this case text/ csv since it is time series data
Size : the size of the data file
Now retrieve the content from the response.
# Take a look at the content of the GET request
temps <- content(url_response)## No encoding supplied: defaulting to UTF-8.## Parsed with column specification:
## cols(
## `date-time` = col_datetime(format = ""),
## `t (C)` = col_double(),
## `error (C)` = col_double()
## )dplyr::glimpse(temps)## Observations: 193,013
## Variables: 3
## $ `date-time` <dttm> 2007-05-21 00:45:00, 2007-05-21 01:00:00, 2007-05...
## $ `t (C)` <dbl> 9.79, 9.81, 9.91, 9.98, 10.04, 10.09, 10.11, 9.97,...
## $ `error (C)` <dbl> 0, 0, 0, 0, 0, 0, 0, 0, 0, 0, 0, 0, 0, 0, 0, 0, 0,...# Clean the variable names
names(temps) <- c("date","degrees","error")# Create a function to GET and clean the results for one site id
get_ruepehu <- function(id) {
url_get <- httr::GET(paste0(base_url,query,id))
# Do not include messages from httr::content function
suppressMessages(content(url_get)) %>%
mutate(site_id=id ) %>%
select(-`error (C)`) %>%
rename(date=`date-time`, degrees = `t (C)`)
}
# Get the temperatures for each of the site ids using map_df and this get_ruepehu function
ruepehu_temps <- map_df(ruepehu_ids,get_ruepehu)Exploratory Data Analysis
Let’s take a quick look at a line plot of this time series using the ggplot R package.
# Create a ggplot object with the date and degress
ggplot(ruepehu_temps) +
geom_line(aes(x=date,y=degrees))+
ggtitle("Mt Ruepehu Crater Lake Temperatures for All Site Monitors")+
theme_light()
Plot the crater reading temperatures with hot and cold colours for each site.
# Facet plot of the temperatures
ru <-
ggplot(ruepehu_temps)+
geom_line(aes(date,degrees,colour=degrees))+
facet_wrap(~site_id)+
scale_colour_viridis_c(option="plasma") +
theme_light() +
theme(axis.title.y=element_text(angle=0))
plotly::ggplotly(ru)